August 2026 Market Update: More Homes for Sale, But Not More Houses
Fewer homes sold in August, and more homes are waiting for buyers. But most of those extra homes are condos. Houses in our area are still selling in about two weeks.
August in 4 numbers
These numbers cover the whole Washington, D.C. metro area. That includes Northern Virginia, D.C., and nearby Maryland.
Why did sales slow down?
Mortgage rates are still high, so many buyers are waiting.
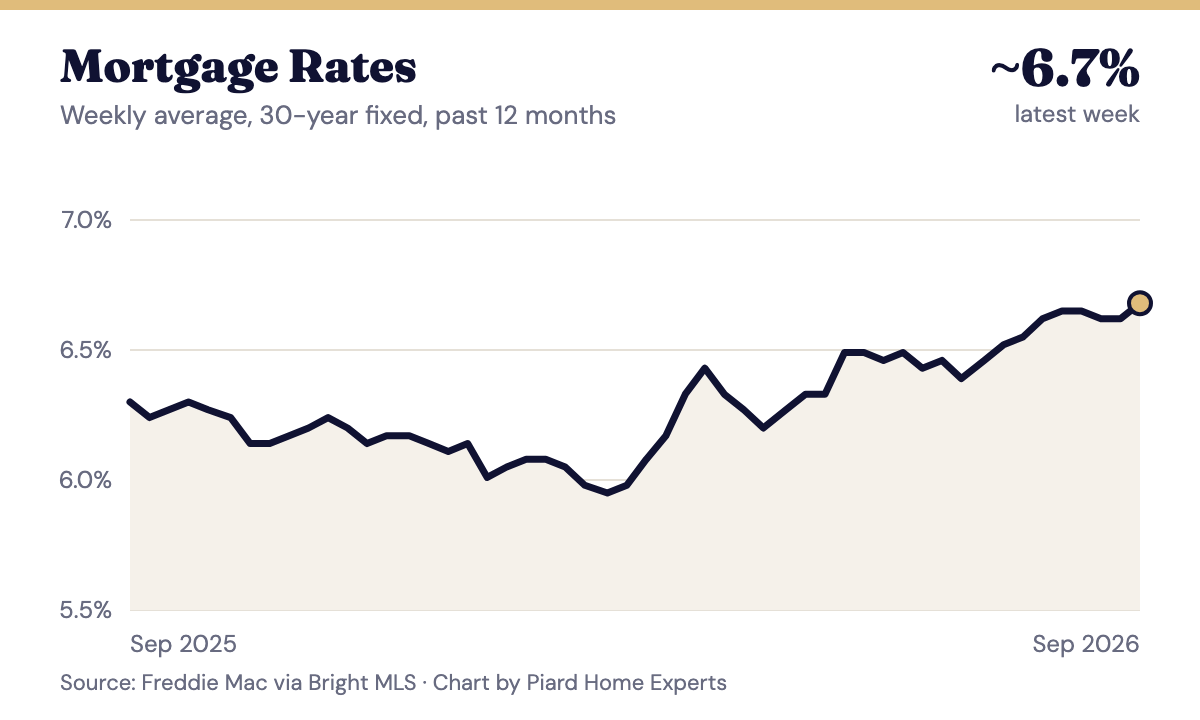
You can see it in the numbers:
- Fewer people toured homes. Showings dropped 7.3% from last August.
- Fewer offers were accepted. New pending sales fell 11.5%. A pending sale is a home with an accepted offer that hasn’t closed yet. It shows what will close in the next month or two.
- Fewer owners listed their homes. New listings fell 3.8%. Most sellers also have to buy their next home, so high rates keep them in place too.
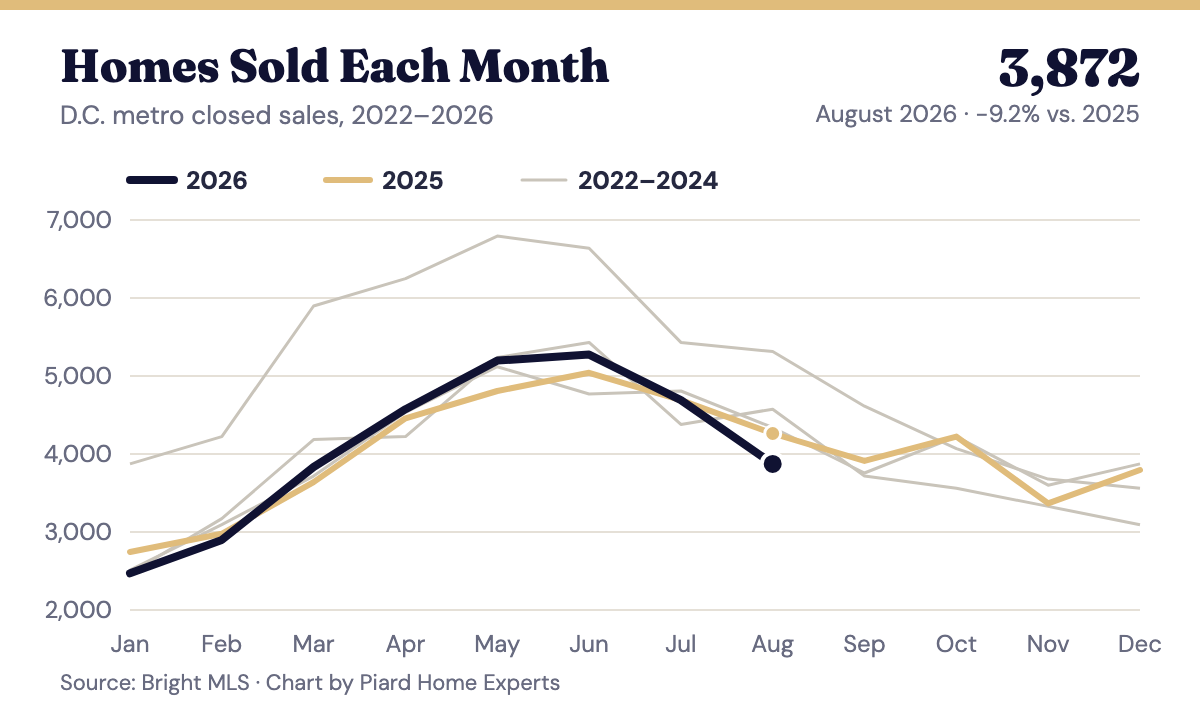
Bright MLS expects a slow fall. It expects fewer buyers and sellers, slower price growth, and homes taking longer to sell.
The whole year still looks normal, though. From January through August, sales are up 0.6% over the same months in 2025. August was slow, but 2026 hasn’t fallen apart.
The big story: the extra homes are mostly condos
You may see headlines saying there are more homes for sale. That’s true. But once you look at the type of home, the picture changes.
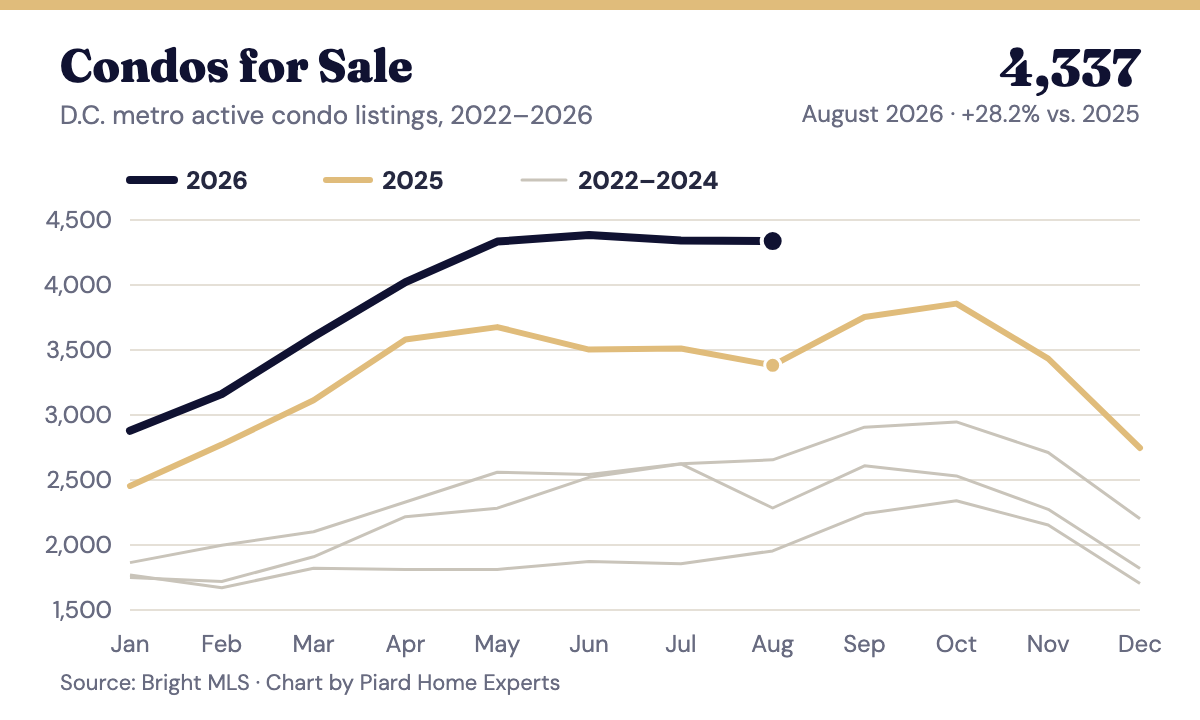
Here’s the part most people miss: there are fewer houses for sale than last year, not more. Detached houses for sale went down by 53. Condos went up by 955.
Condos also lost the most sales. The metro had 392 fewer sales than last August, and 262 of those were condos. That’s about 2 out of every 3.
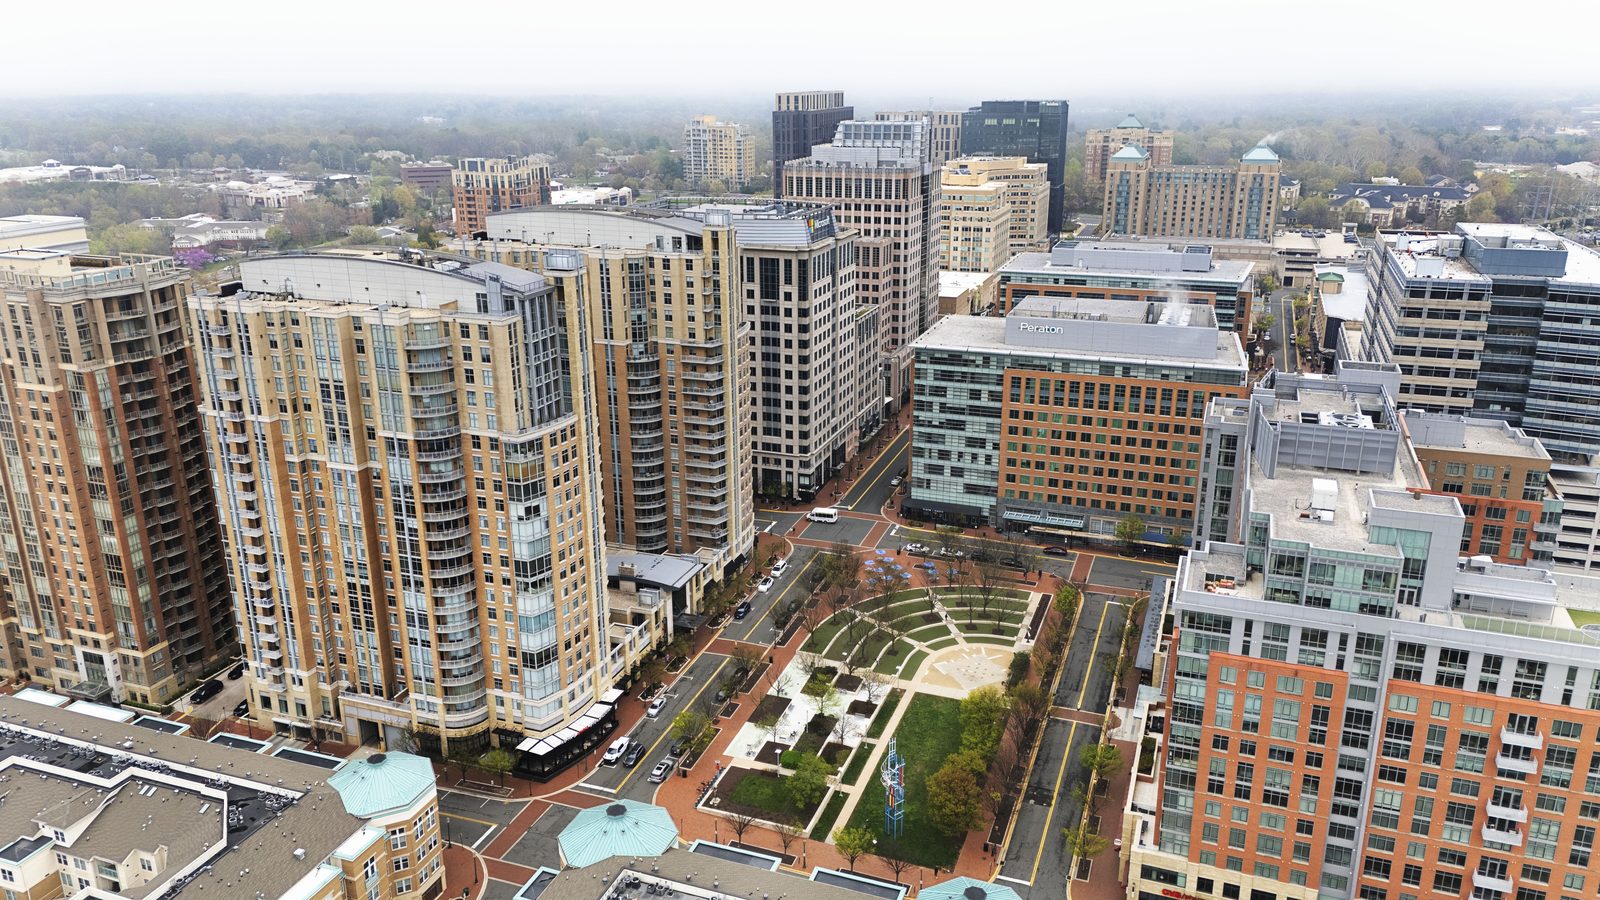
Houses, townhomes, and condos are three different markets
Tap a home type to see how it did in August.
How long homes take to sell
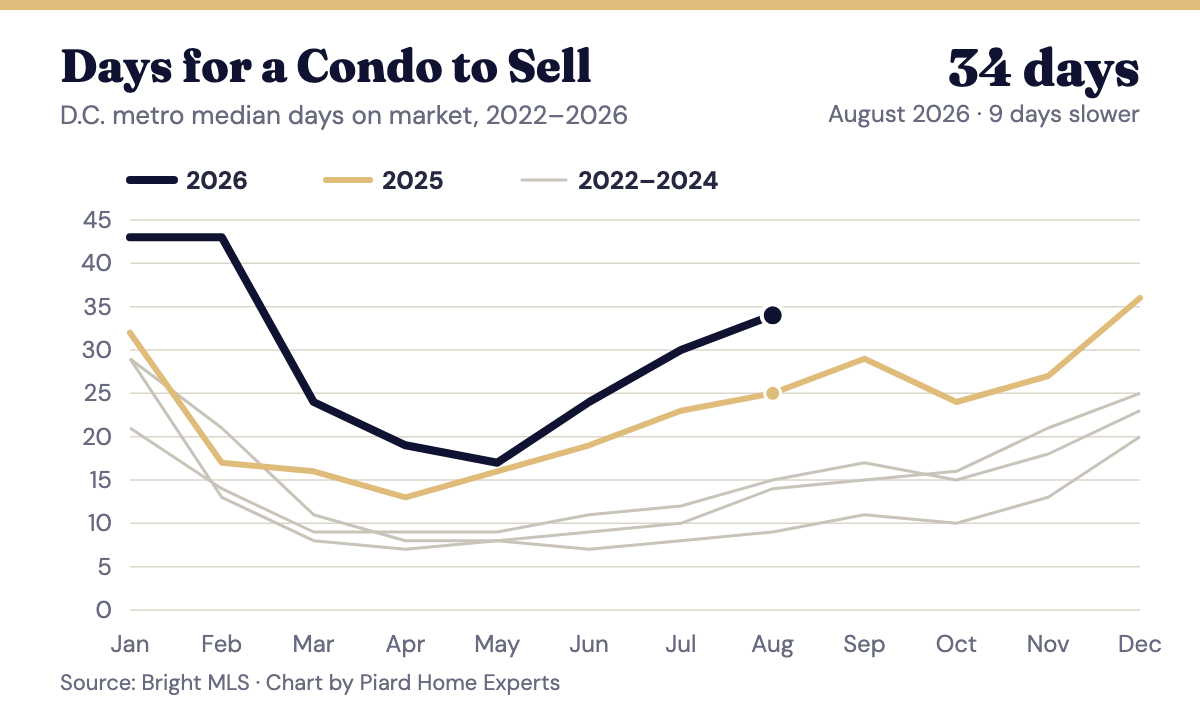
Houses sold 3 days faster than last August. Condos sold 9 days slower. In this market, the type of home matters more than the overall numbers.
Check your area
Pick an area to see its August numbers.
Are prices falling?
Not really. The metro median price is up 2.4% from last August. It did dip 1.5% from July ($650,000 to $640,000). Prices often ease a little as summer ends. They did last year too.
Condos are the exception. The median condo price fell 5.7%, from $410,000 to $386,500. The median house price held steady at $835,000, the same as last August.
More homes are for sale, but not more houses. The slowdown is mostly a condo story.
If you’re buying
- Shopping for a condo? You have more choices and more time. There are 28% more condos for sale than last year, and the typical one takes over a month to sell. That can give you room to ask for things like help with closing costs.
- Shopping for a house? Don’t expect a big slowdown. There are fewer houses for sale than last year, and they sell in about two weeks. Get pre-approved before you start touring.
If you’re selling
- Selling a house? Buyers are still out there. A well-priced house is still selling in about two weeks.
- Selling a condo? Plan for more time on the market, and price it for today’s market, not last spring’s. With 4,337 condos for sale, buyers can compare and skip homes that are priced too high.
The bottom line
August was a slow month, but the story depends on what kind of home you own or want. The numbers for the whole metro won’t tell you much about your own home. If you want to see the numbers for your street, just ask. No pressure.
Data sources: Bright MLS August 2026 Housing Market Report for the Washington, D.C. Metro, plus Bright’s August 2026 reports for detached houses, townhomes, and condos in the same region (data as of September 4, 2026). Herndon, Reston, and Sterling figures are from SmartCharts (MarketStats by ShowingTime), using Bright MLS data calculated September 4, 2026. The inventory and lost-sales breakdowns by home type are Piard Home Experts calculations from Bright’s published numbers. Information deemed reliable but not guaranteed.