The Great Inventory Illusion

Homes for sale across the D.C. metro just hit a seven-year high — and the median home still sold in 15 days, exactly the same speed as last July. Here’s where the “wave” actually came from, and what it means for Northern Virginia.
The headline stat this month writes itself: 11,431 active listings across the Washington D.C. metro in July, up 11.2% from a year ago and — in Bright MLS’s own words — the highest inventory level since 2019. Buyers finally have choices again.
Here’s the number that should be quoted right next to it, and won’t be: the median home still went under contract in 15 days. That’s identical to last July. Seven years’ worth of extra inventory arrived, and the market’s clock didn’t move.
We made this month’s video about exactly that gap — watch it, then keep reading for the numbers.
Prefer YouTube? Watch “The Great Inventory Illusion” there.
Where the extra listings actually came from
Bright publishes separate monthly reports for detached single-family homes, attached homes and townhomes, and condominiums. Add the three property types together and they reconcile exactly to the published metro total — 4,357 + 2,731 + 4,343 = 11,431 — which means the breakdown below isn’t an estimate. It’s arithmetic.
| Property type | July 2025 | July 2026 | Net change | Change |
|---|---|---|---|---|
| Condos | 3,510 | 4,343 | +833 | +23.7% |
| Attached / townhomes | 2,479 | 2,731 | +252 | +10.2% |
| Detached single-family | 4,294 | 4,357 | +63 | +1.5% |
| D.C. metro total | 10,283 | 11,431 | +1,148 | +11.2% |
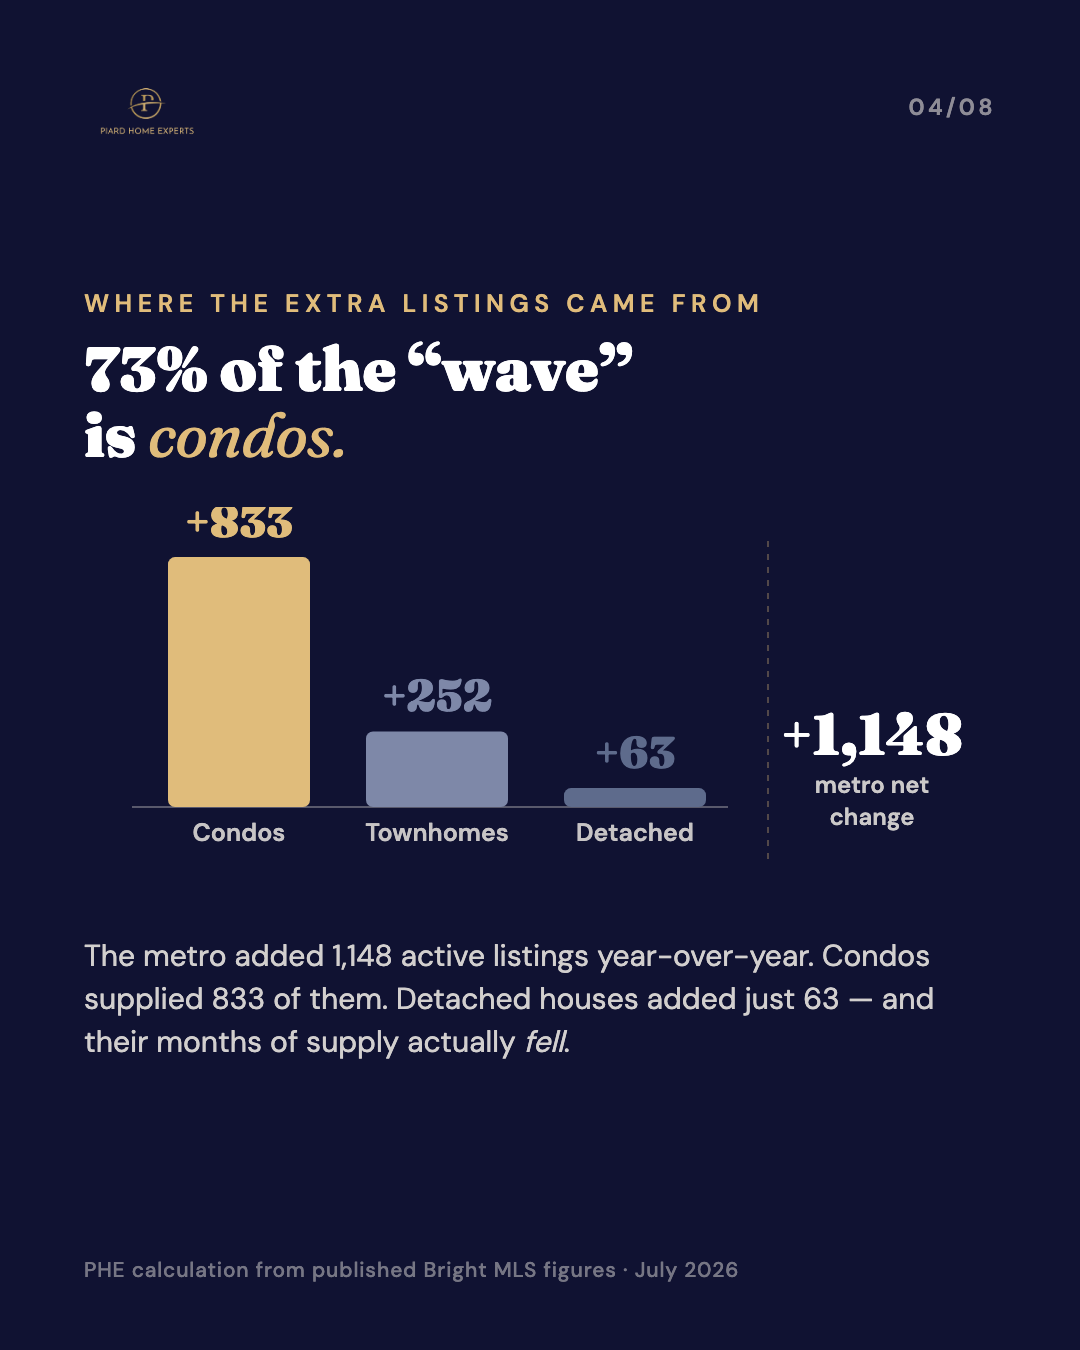
The metro added 1,148 homes to the active market. Condos supplied 833 of them — about 73%. Detached houses added just 63, and their months of supply actually fell.
Piard Home Experts calculation from Bright MLS published figures.
In June we wrote that detached inventory had outright fallen year-over-year. July softened that story slightly — 63 more houses than last year is technically an increase — but the substance holds: for the second straight month, the “inventory wave” is overwhelmingly a condo story. If you were hoping it meant meaningfully more single-family houses to tour in Fairfax or Loudoun, 63 homes spread across an entire metro isn’t it.
Three property types, three different markets
Once inventory splits like that, everything downstream splits with it — how fast homes sell, how much competition a seller faces, whether a buyer has any leverage at all.
| Detached | Townhomes | Condos | |
|---|---|---|---|
| Median sold price | $849,995 | $607,500 | $392,500 |
| Price change (YoY) | +1.2% | +1.3% | −1.6% |
| Median days on market | 11 days | 13 days | 30 days |
| Change vs. July 2025 | 1 day faster | unchanged | 7 days slower |
| Months of supply | 2.23 | 2.34 | 4.21 |
| Supply vs. July 2025 | tighter (2.27) | up from 2.13 | up from 3.23 |
| Closed sales (YoY) | +2.0% | +2.6% | −6.7% |
| New pending sales (YoY) | −4.1% | +3.4% | −11.8% |
Read the days-on-market row again. A detached house in this metro went under contract in a median of 11 days in July. A condo took 30 — nearly three times as long, in the same region, in the same month, and seven days slower than a condo took last year.
And look at the supply row: detached months of supply fell from 2.27 to 2.23 while the metro number climbed. The property type everyone assumes benefits from “more inventory” is the one type that got tighter.
The shoppers who left — and the buyers who didn’t
One more July number deserves attention: showings across the region fell 4.7%. Fewer people are touring homes. But new pending sales only slipped 4.2%, and across the broader Mid-Atlantic, 42% of everything that sold in July — 9,031 of 21,407 homes — went in ten days or less on the market.
Put those together and you get the real shape of this market: the casual, “just seeing what’s out there” shoppers stepped back, and the buyers who remain are serious and fast. The market has effectively split into two lanes — homes that are priced right and sell almost immediately, and homes that sit while buyers comparison-shop an 11,431-deep menu. Pricing decides the lane.
What it looks like closer to home
Northern Virginia still sits at the tight end of all of this. Even at a seven-year metro inventory high, Loudoun and Fairfax hold the lowest months-of-supply figures of any large jurisdiction in Bright’s regional table.
| Jurisdiction | Median price | YoY | Days on market | Months of supply |
|---|---|---|---|---|
| Loudoun County | $813,000 | +7.4% | 13 days | 1.96 |
| Fairfax County | $755,448 | −1.2% | 10 days | 2.01 |
| Alexandria City | $710,000 | +3.6% | 12 days | 2.43 |
| Arlington County | $823,000 | +15.9% | 13 days | 2.49 |
| D.C. metro overall | $650,000 | +1.6% | 15 days | 2.75 |
Two honest notes on that table. First, those county figures combine all property types — a county with heavy condo inventory will look softer than its single-family market actually is, and Bright doesn’t publish a county-by-property-type cut, so anyone claiming the exact condo-versus-house split for Herndon or Reston is guessing. We won’t. Second, yes, Fairfax County’s median slipped 1.2% — with homes still selling in ten days on two months of supply. A one-percent median move in a fast, tight market says more about which homes sold than about values falling.
If you’re buying
You finally have choices. What you have less of is company — and that combination is an opening.
Looking at detached houses in Fairfax or Loudoun? Nothing got easier this year. Supply is around two months, the median house went under contract in 10–13 days, and there are barely more of them listed than last July. Being fully pre-approved before you tour isn’t an edge in that segment — it’s the entry ticket. Know your walk-away number before you write.
Open to a condo? This is the genuine opening, and it’s wider than it was in June. There are 833 more on the market than a year ago, supply has climbed to 4.21 months, the typical one takes 30 days to go under contract, and median prices actually eased 1.6%. That’s room to ask for a repair credit, a rate buydown, or a closing-cost contribution — and room to sleep on it before you decide.
If you’re selling
If you own a house in Northern Virginia, the inventory headlines aren’t describing your street. Detached supply is tighter than last July, detached sales rose 2.0%, and the median house sold in 11 days at $849,995. A well-prepared, correctly priced house should still see real competition in its first weekend.
If you own a condo, plan for a 30-day marketing window and price to where the market is now — not where it was in 2024. With 42% of the region’s sales going in ten days or less, buyers read days-on-market as a signal. Starting high and adjusting later almost always nets less than pricing correctly on day one.
More homes for sale than any month since 2019 — and the well-priced ones are still gone in days. The “wave” is real. The slowdown is the illusion.
The honest summary
Demand hasn’t left the D.C. metro — it’s gotten pickier. Closed sales were flat in July, year-to-date sales are running 2.0% ahead of 2025, and the broader Mid-Atlantic did $12.0 billion in July volume, up 7.3% from last year. What’s changed is that buyers now have a real menu, and they’re using it to skip anything overpriced.
The metro average won’t tell you much about your situation. Your property type and your county will. If you’d like to see what those look like for your specific address, we’re happy to walk you through it — no pressure, just the numbers.
Data source: Bright MLS, July 2026 Housing Market Report, Washington D.C. Metro; Bright’s July 2026 Detached Single-Family, Attached/Townhomes, and Condos reports for the same region; and the SmartCharts July 2026 Mid-Atlantic Detailed Report. Data as of August 6, 2026. Inventory attribution and supply-gap figures are Piard Home Experts calculations from Bright’s published figures. Information deemed reliable but not guaranteed.